
1.4.1Can you walk the walk?
Distance and Velocity
Shant and Kier each took a
Shant’s Walk: Start close to the motion detector. Begin walking at a very fast rate and gradually slow down to a stop. Then increase your speed gradually until you are walking as quickly as when you started.
Kier’s Walk: Start close to the motion detector. Begin walking at a very slow rate and gradually speed up to the fastest speed you can achieve. Then gradually slow down to your starting speed.
Complete the tasks below in any order:
Sketch a distance vs. time graph of each scenario
Walk the walk.
Compare the two walks. Is there a relationship between the graphs of the two scenarios?
THE SLOPE WALK, Part Two
During her
If the graph represents her distance traveled, describe her motion.
State the time interval when Diamonique was walking toward the motion detector. When did she walk away from the motion detector? When did she change directions? Justify your answers.
On what interval(s) of time was Diamonique standing still? Justify your answer.
Estimate a time when Diamonique was walking fastest. Justify your answer.
Estimate a time when Diamonique was slowing down. Justify your answer.
Now assume that the graph represents velocity vs. time—in other words, let the
-axis represent velocity. Similarly describe her motion.
FUNDAMENTALLY THE SAME
Fredo (short for Alfredo) and Frieda were both given the responsibility to collect data for a foot race. After watching the event, the Fredo and Frieda gave the coach graphs of their data, shown below.
Fredo’s Graph

Frieda’s
.png)
The coach is dismayed because the graphs are different. However, Fredo and Frieda know that they watched the same race and that their data is confirmed in the other’s graph. Your goal is to help them convince their coach that the graphs represent the same race.
To help the coach understand the graphs, label each graph with the appropriate (and reasonable) units.
Explain how Frieda’s graph confirms Fredo’s and how Fredo’s graph confirms Frieda’s.
.png)
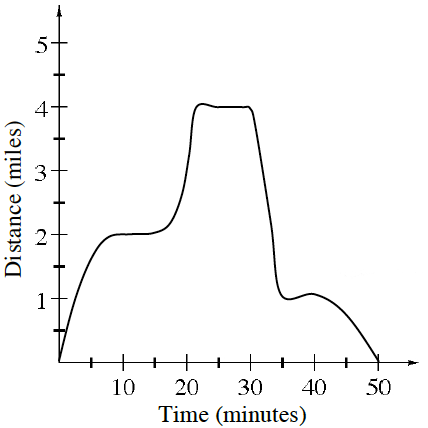
Ellen rode her bike one morning to visit some friends. Her distance from home is documented in the graph at right.
Estimate her rate (velocity) in miles per hour for times
, , and minutes. Describe your strategy. How is Ellen’s velocity related to the graph of her distance from home?
What is her total distance traveled?
.png)
As a team, summarize what you learned about the relationship between distance and velocity from problem 1-135. Be prepared to share your statements with the class.

A portion of the graph of
Sketch the rest of the graph if
is even and calculate the area under the curve for . Sketch the rest of the graph if
is odd and calculate the area under the curve for .
.png)
What value of
The graph of
Sketch
. Sketch
. Sketch
.
.png)
State the domain of each of the following functions. Note: The functions mentioned in parts (c) and (d) refer to those in parts (a) and (b). Homework Help ✎
For each function, use algebra to identify all holes and asymptotes. Homework Help ✎
Velocity is only one example of a rate of change. Name at least two other familiar rates that you encounter in your daily life. Homework Help ✎
Let
Cynthia began to draw midpoint rectangles to approximate the area under the curve for
.png)
Each of of the functions below has one or more holes and/or asymptotes. Graph the functions on your graphing calculator and write a complete set of approach statements for each function. Homework Help ✎